| home | download centre | buy online | about us |
HSC Chemistry, HSC Chemistry 7, Software for Process simulation, Reactions Equations, Heat and Material Balances, Equilibrium Calculations, Electrochemical Cell Equilibriums, Eh-pH Diagrams – Pourbaix diagram
|
|||||||||||
|
|||||||||||
| TPP DIAGRAMS – STABILITY DIAGRAMS | ||
|
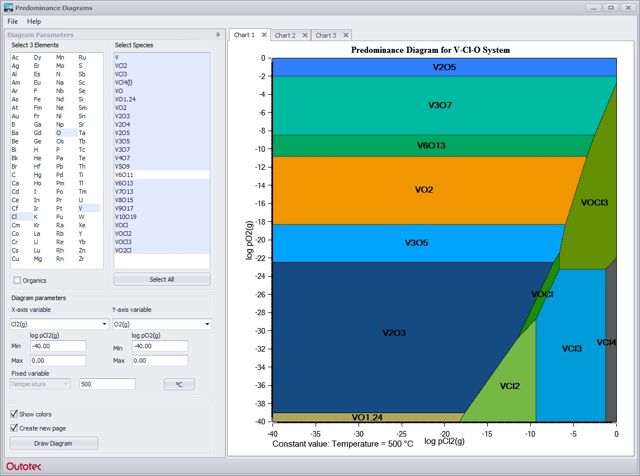
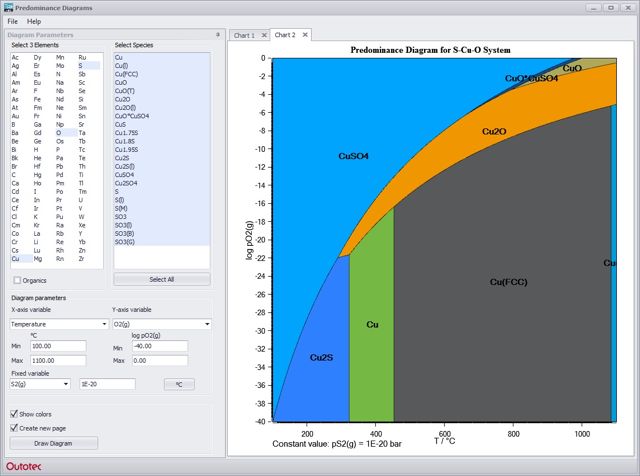
HSC Tpp The new HSC Chemistry 8.0 can draw two types of phase stability diagrams. The new Tpp Diagram module calculates the diagrams on the basis of minimum Gibbs energy (area graphics) and the old Lpp Diagram module calculates the phase stability boundaries as lines based on the reaction equations (vector graphics). These two modules have their own option buttons in the HSC main menu, i.e. Tpp and Lpp Diagram buttons. The Tpp diagram module draws temperature partial pressure diagrams (T-p diagrams) as well as p-p diagrams with partial pressures on both axes. The old Lpp module only draws diagrams with selected partial pressures on both axes. Both these modules offer slightly different benefits and limitations; for example, the old Lpp module gives exact coordinates for the phase boundaries but the new Tpp module gives illustrative painted area diagrams and also a versatile T-p axis option. The Tpp Diagram module calculates phase stability diagrams using partial pressures on both axes or temperature on the x-axis and partial pressure on the y-axis. This module calculates the diagram on the basis of minimum Gibbs energy. However, it does not check each x- and y-point in order to decrease calculation time. The calculation is made recursively using the preset resolution and a specific logout algorithm.
|